Product update
If investors can’t use your data, they won’t choose your location
Data visualisation has become central to how investment promotion organisations (IPAs) and economic development organisations (EDOs) compete, but it delivers little when treated as a cosmetic add-on. IPAs and EDOs influence location decisions by making data clear, current and easy to use. In practice, how data is presented has become as important as the data itself.
- March 31, 2026
-
By Russell Riblett
Data visualisation is no longer optional for investment promotion websites
Global Investment Promotion Agencies (IPAs) and Economic Development Organisations (EDOs) operate in an increasingly competitive environment. A handful of places benefit from instant global recognition. If you are in Tokyo, London, or New York, your name already does some of the work. For thousands of other locations, standing out requires more than a good message. It requires a better way to prove your value.
That is where data becomes a competitive advantage.
For many IPAs and EDOs, the website is the first real test of their investment proposition. It is where investors, site selectors, corporate advisors, and internal stakeholders go to assess whether a location deserves a closer look. The challenge is not whether to include data. It is how to present that data in a way that is clear, credible, useful, and persuasive.
That is no small task. Your audience is diverse. One visitor may want a quick snapshot of workforce availability, operating costs, or industry strengths. Another may want to go deeper, compare indicators, explore trends, and validate assumptions. A high-performing website must serve both. It must help the untrained visitor understand the story quickly while still offering enough depth for more analytical users.
This is why data visualisation matters.

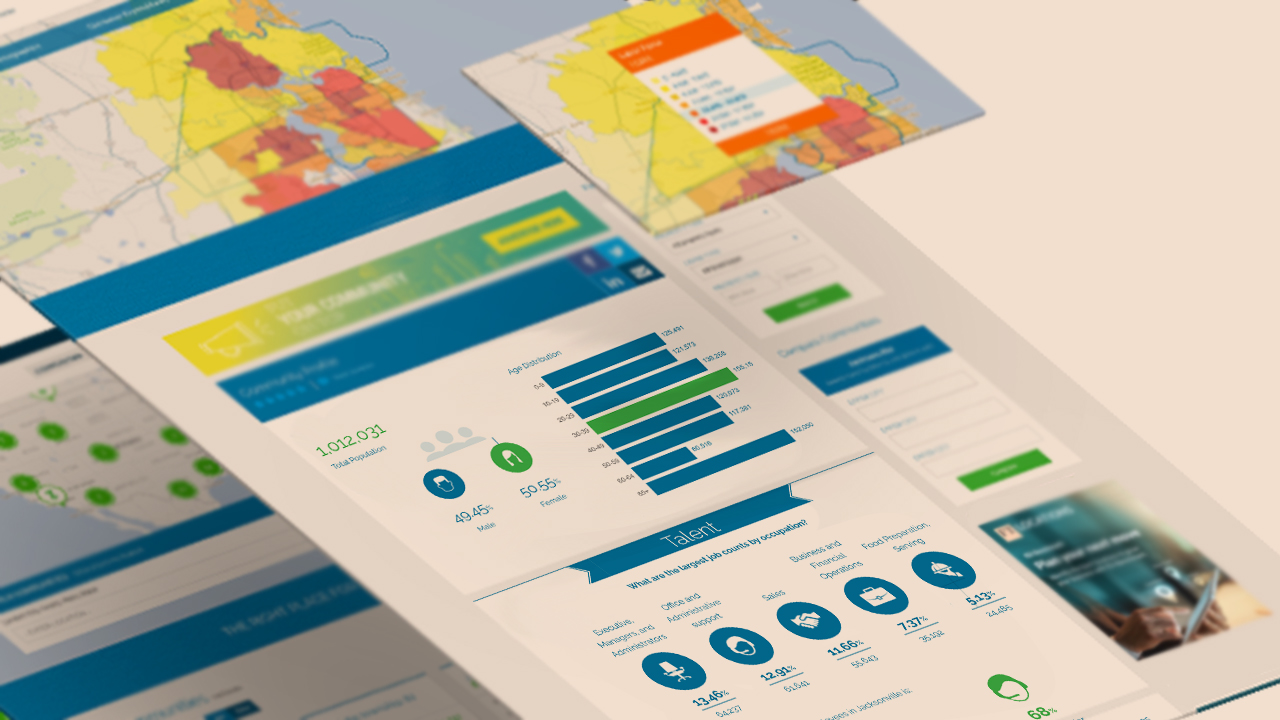
Data visualisation should make complex information easy to find, understand and interact with.
Data visualisation helps investors think faster
Data is complex. It can be presented as raw numbers, percentages, rankings, charts, maps, or layered comparisons. But complexity alone does not create value. In fact, if the information is hard to navigate, buried in PDFs, or spread across static pages, it can create friction at the exact moment a prospective investor is trying to evaluate your location.
Investors are not browsing your website casually. They are often comparing multiple places at once, under time pressure, and with specific questions in mind. The more quickly they can find, understand, and use your data, the more credible and investment-ready your location appears.
Allowing users multiple ways to visualise the same information helps them make informed decisions and uncover insights a typical spreadsheet might not expose. Good visualisation does not simplify the truth. It makes the truth easier to access.
Interactivity should reduce effort, not increase it
Data must be interactive, but interactive does not mean complicated.
The best digital experiences let users generate the answers they are looking for without forcing them through a maze of menus, downloads, and outdated documents. Interactivity should shorten response times. It should help a visitor move from curiosity to understanding with less effort.
For marketing and communications teams, that means creating a more engaging user experience. For research teams, it means presenting complex information in a format that can be explored, not just published. For organisations, IPAs and EDOs, it means giving prospects the ability to self-serve key answers before a meeting even takes place. And for C-suite leaders, it means having a website that works harder as a business development tool.
In other words, effective data visualisation is not just a design feature. It is a strategic function.
Current data builds confidence
Current data is king because credibility is fragile.
How often do investors visit a website only to find that the latest downloadable fact sheet is several years old? Outdated information raises doubts immediately. Is the organisation paying attention? Are the figures reliable? If this data is old, what else is no longer current?
There are many reasons this happens. Sometimes teams do not realise old data still sits on the site. Sometimes the latest figures are difficult to source and update. Sometimes refreshing website content simply falls behind other priorities. But whatever the reason, stale data weakens confidence.
Having current information on your location is essential to keeping visitors engaged and moving forward. Dynamic, interactive data sources help answer the timeliness question before it becomes an objection. They also reduce the burden on teams trying to manually maintain static content across multiple pages and formats.
Data visualisation does not replace the story. It strengthens it.
One of the core responsibilities of an EDO is to tell the location’s story. Data is central to that task.
Strong data visualisation does more than display metrics. It gives context to your value proposition. It helps demonstrate market access, workforce characteristics, sector strengths, business climate advantages, and other factors investors care about. It turns claims into evidence.
It can also help reframe metrics that might otherwise be misunderstood. A high unemployment figure, for example, may raise questions in one context but signal workforce availability in another. Data, when presented clearly and honestly, allows a location to tell a more nuanced and credible story.
That is especially important in investment promotion, where trust matters. The goal is not to overwhelm visitors with figures. The goal is to weave data into your community promotion messaging in a way that validates who you are and why you are worth considering.
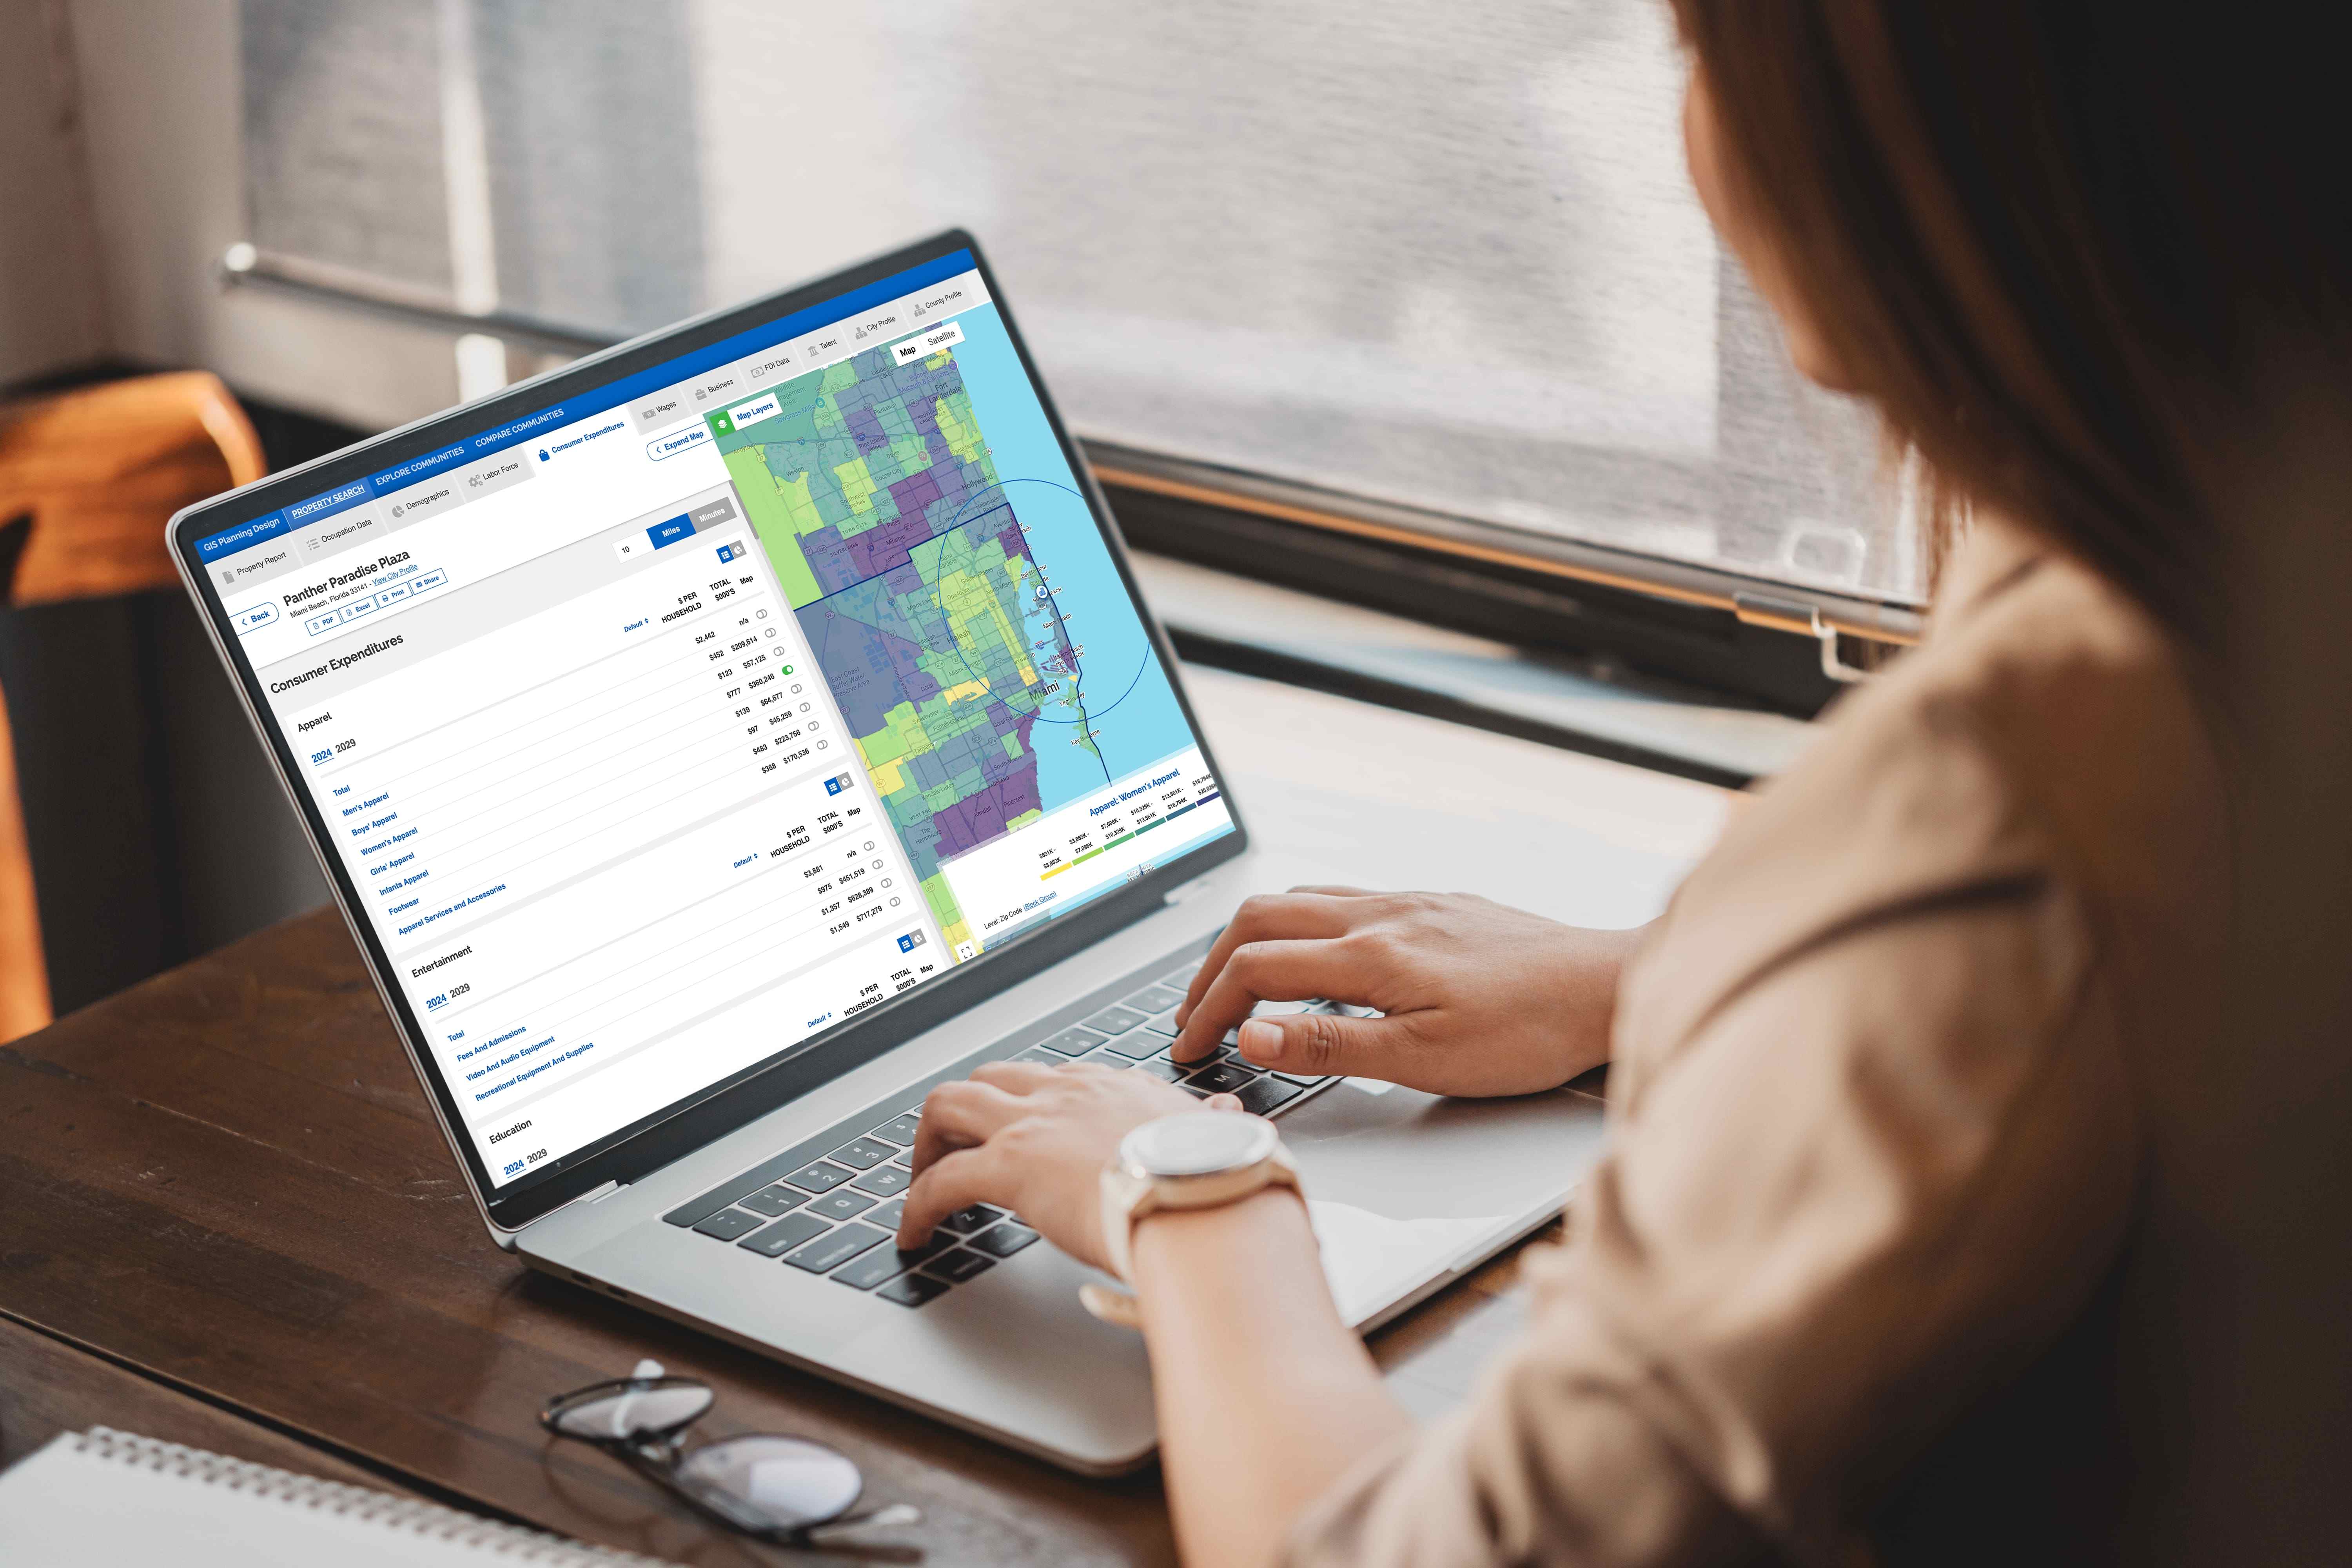
Bring your location data to life on your website with ZoomProspector
Your website data strategy is now part of your investment strategy
This is the bigger picture. Data visualisation is not a nice-to-have website feature. It is part of how a location competes.
The organisations that do this well are not simply publishing information. They are making it easier for investors to understand them, compare them, and build confidence in them. They are reducing friction in the investment journey. They are creating a stronger digital first impression. And they are equipping their own teams with a better platform for sales conversations and follow-up engagement.
The organisations that do this well are not simply publishing information. They are making it easier for investors to understand them, compare them, and build confidence in them. They are reducing friction in the investment journey. They are creating a stronger digital first impression. And they are equipping their own teams with a better platform for sales conversations and follow-up engagement.
That is where ZoomProspector comes in.
ZoomProspector helps bring clarity to complex data. It gives website visitors a more intuitive way to explore information, engage with a location at their own pace, and access current, decision-ready insights. For IPAs and EDOs, that is more than a technology upgrade. It is a strategic decision to provide investors with a better experience and a clearer case for why their location should make the shortlist.
Data visualisation is not the future of economic development websites. It is the expectation.
If your current website still relies on static files, fragmented datasets, or hard-to-update pages, this may be the right time to rethink your data strategy. Book a demo to see how ZoomProspector can help turn your website into a more effective investment attraction tool.
Further reading
Transform your website with data visualisation today using ZoomProspector
Read blog: Webinar recap: What’s next for FDI?
Read blog: The new FDI map - the rise of investment blocs in a fragmenting world
Read blog: Targeting investors and markets in a multipolar world
Learn more about FT Locations
FT Locations is the world's most comprehensive and trusted provider of investment promotion and economic development data and digital solutions for the foreign and domestic direct investment industry.
