Why fDi Benchmark?

Assess cost and quality competitiveness of countries and cities worldwide

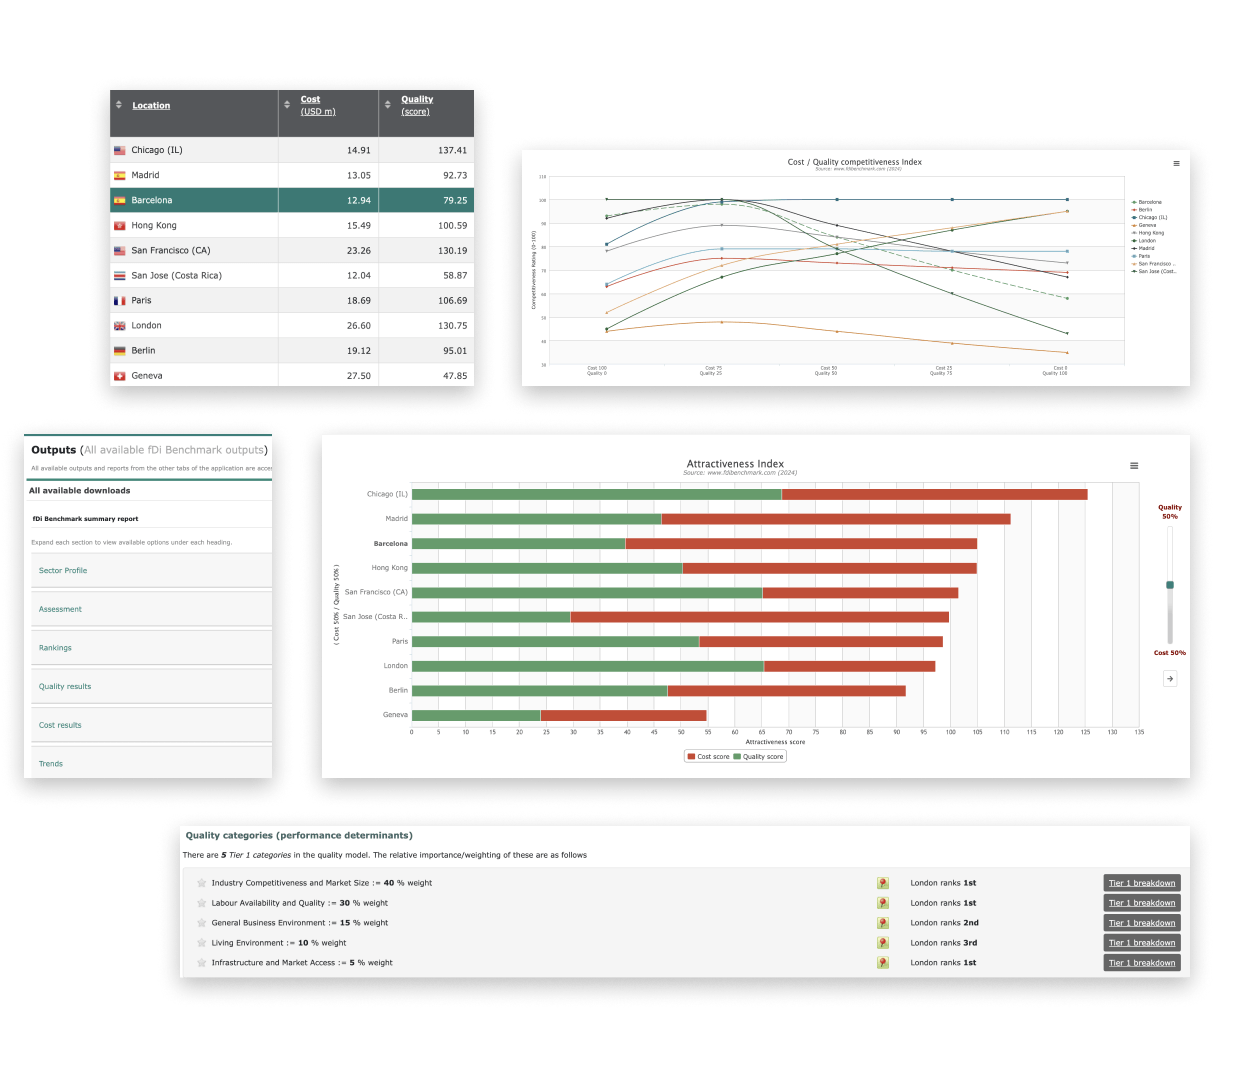
Assess the relative competitiveness of 900+ locations across 152 sectors. Our unique patented algorithmic technology is used by locations, intermediaries and investors alike to assess global footprint strategies.

Comparative data to drive marketing strategies

Respond quickly and consistently to investment enquiries, as well as producing business cases customised to target investors.

  • 3.1k
    Data points
  • 152
    Sectors
  • 900+
    Locations

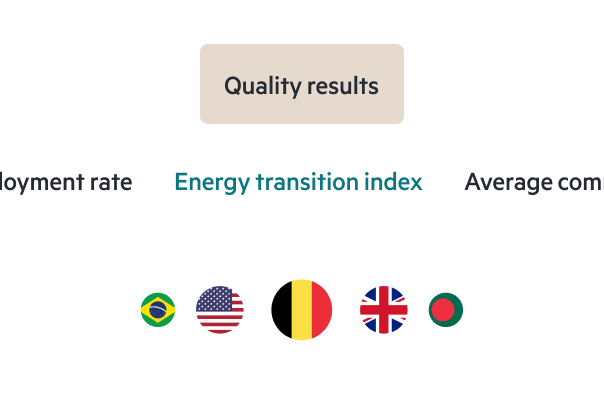
We continually track quality and cost data points across the globe at country, state and city level.

Prepare compelling business cases and value propositions

Reply to and approach investors proactively with solid, data-driven and sector-specific investment propositions to get your location on the shortlist.

Sharpen your marketing and PR

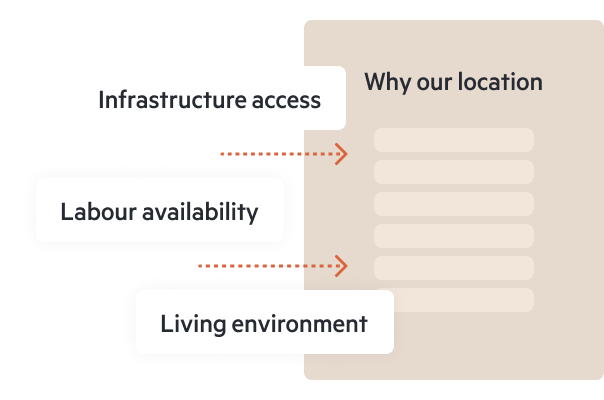
Identify your key USPs against competing locations within seconds and complement your press releases and marketing material with independent data and graphs.

Streamline the site selection decision

Save time, capital and team resources by quickly accessing information on locations that your organisation can rely on and shortlist potential location options based on objective criteria.

Discover how fDi Benchmark can help your role or organisation

User manuals and video tutorials

A user manual and short videos on key features will help you maximise the benefits of fDi Benchmark for your organisation.

Dedicated account manager, training and onboarding

Access to an exclusive member of the account management and onboarding team to guide you through the features and benefits of the system - aligned to your organisation's specific requirements.

Contact us for a demonstration of fDi Benchmark

Decisions driven by intelligence

Request a demo
Benefits

How fDi Benchmark can help your role or organisation

Identify new business opportunities, better inform your investment decisions and empower your organisation with unrivalled FDI data.

Prepare compelling business cases and value propositions

  • Approach potential investors proactively with a solid, data-driven business proposition.
  • Reply to investors' enquiries within minutes.
  • Prepare sector specific investment propositions to get your location on the short list.
  • Customise your benchmarking studies to suit the needs of the investor.
  • Focus all commentary, charts and tables on your chosen location by using our Key Location feature.

Sharpen your marketing and PR

  • Identify your key USPs against competing locations within seconds.
  • Customise your reports by including your own cover page, contact details and report structure.
  • Download independent reports and charts in multiple formats.
  • Complement your press releases and marketing material with independent data and graphs.

Advocate key policies by backing up strategies with actual trends

  • Input into senior managers' recommendations with actual market trends. This can be used as policy advocacy or for underpinning future strategies.
  • Understand your location's position relative to competing locations by using our SWOT analysis.

Verify your other data sources

  • Avoid using unchecked information on location competitiveness - fDi Benchmark aggregates and standardises information from the leading data sources, displaying this reliable content in an easy-to-use format.
  • Identify incorrect or outdated data points used by potential investors that might be impacting on your location's chances of being shortlisted.

Trend selected data points

  • Spot and analyse key developments. Historical data is available for a selection of data points, providing you with the ability to capture emerging trends, as well as changes in the locations of your choice.
  • Explore trends across hundreds of Quality and Cost data points.

Save time and money

  • Deliver powerful, independent outputs in minutes, significantly reducing your response time to investors.
  • Use fDi Benchmark as your outsourced research team.

Streamline the site selection decision

  • Save time, capital and team resources by quickly accessing information on locations that your organisation can rely on.
  • Shortlist potential location options based on objective criteria.

Carry out comprehensive site assessments

  • Compare over 900+ locations globally using FDI assessment criteria.
  • Validate your current and potential investment locations using strictly independent criteria.

Analyse a location's trends at country, regional or city level

  • Trend data is available for a selection of data points, providing you with the historical and transitional view of locations.

Understand the strengths and weaknesses of the locations that matter to you and to your clients

  • View comparative insights showing the relative strengths, weaknesses, opportunities and threats of 900+ locations worldwide, including graphs that you can add to your presentations.
  • Search through more than 2,500 Quality and Cost data points for input into both client and internal reports.
  • Rank the locations of your choice across more than 153 different industry sectors.

Monitor trends in selected data points

  • Spot and analyse key developments. Historical data is available for a selection of data points, providing you with the ability to capture emerging trends, as well as changes in the locations of your choice.
  • Explore trends across hundreds of Quality and Cost data points.
  • Customise our sector models to produce operating cost simulations and value proposition reports based on your clients' requirements for the current year, as well as 3-5 year projections.
  • Investigate salary data on over 200 job positions.

Save time and money

  • Deliver the independent outputs that you need in minutes, significantly reducing your response time.
  • Filter the output to focus on the information that matters to you - the Key Location feature enables all commentary to be focused on the location of your choice.

Sharpen your marketing and PR

  • Validate your recommendations and complement your analysis. fDi Benchmark is a credible source of greenfield FDI information, allowing you to add trustworthy data to your reports and white papers, as well as complement your press releases and marketing material.

This is a superb tool for creating operating cost comparisons with other major cities around the world. It allows us to distinguish ourselves by costs but also to find credible data in a large number of industries.

Vesna Poljicak MTL International

fDi Benchmark is a useful tool to DBT in supporting investment officers in service delivery by providing fast and credible location comparisons between the UK and other countries.

Head of Propositions Department of Business and Trade

The FT tools we subscribe to are absolutely amazing and enable us to engage investors on a higher level. fDi Benchmark has ensured that we have a value proposition to offer. Companies that we meet are quite impressed and find the information very relevant.

Investment Manager Wesgro

Contact us for a demonstration of fDi Benchmark

Decisions driven by intelligence

Request a demo
Frequently asked questions

fDi Benchmark FAQs

fDi Benchmark sources its content from a number of leading global data sources, including the World Bank, the International Monetary Fund, Dun & Bradstreet, Towers Watson, National Statistical Agencies and the Financial Times.

In total, fDi Benchmark includes c.2,500 data points at the country level and c.600 at the state/city level. Data sources are clearly labelled in fDi Benchmark, including in graphs, tables and downloads.

The data is updated on a quarterly or annual basis, depending on the specific data point. Data newly released by our sources is typically updated on fDi Benchmark within one month.

fDi Benchmark currently has 153 sector profiles built into the application. The sector profiles have been built to represent typical investment projects across various sectors and include a quality and cost model to help benchmark the competitiveness of locations and assess their relative strengths and weaknesses.

Each sector profile includes a pre-determined three-tier weighted quality model. The cost model includes information on typical headcount, property and utility usage for that sector profile.

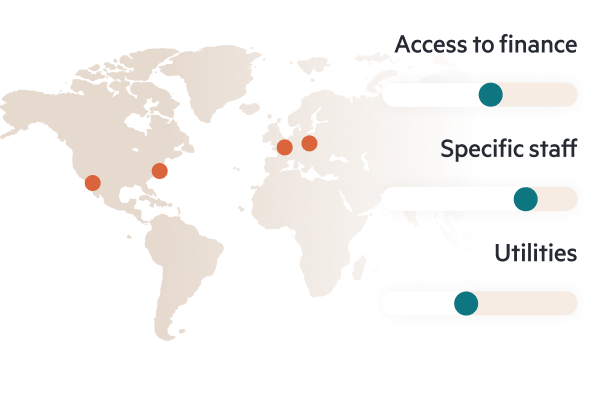
However, as each investment project is different, fDi Benchmark provides easy-to-use tools to tailor the quality data weights, operating costs quantities and employee information to the specific requirements of individual projects.

fDi Benchmark includes data on over 1,000+ locations, between country, state and city level. New locations can be added to the platform depending on data availability.

fDi Benchmark data dashboard showcasing various charts and tables related to cost and quality competitiveness. The top left section lists locations such as Chicago, Madrid, and Barcelona, along with their respective cost and quality scores. A line graph on the top right visualizes the 'Cost/Quality Competitiveness Index' across multiple locations. The bottom right features a bar chart titled 'Attractiveness Index,' comparing cost and quality factors for different cities. Additional sections provide downloadable benchmark reports and performance categories, such as sector profile, assessment, rankings, and trends.

Contact us for a demonstration of fDi Benchmark

Decisions driven by intelligence

Request a demo
A Nikkei Company
Loading...